Fueling your journey to inspire, overcome, and motivate towards a brighter future. Join us today
Log In
Sign Up
Don’t have an account yet? Sign Up
Already have an account? Sign In
By signing up, I accept IOMH (Terms & Conditions)
Ready to master Python for Data Science & ML? Learn from zero with hands-on projects, Pandas, NumPy, and real ML models.
Enrolled Students: 0
Join our Python for Data Science & Machine Learning: Zero to Hero course and discover your hidden skills, setting you on a path to success in this area. Get ready to improve your skills and achieve your biggest goals. The Python for Data Science & Machine Learning: Zero to Hero course has everything you need to get a great start in this sector.
Improving and moving forward is key to getting ahead personally. The Python for Data Science & Machine Learning: Zero to Hero course is designed to teach you the important stuff quickly and well, helping you to get off to a great start in the field. So, what are you looking for? Enrol now!
This course covers the topic you must know to stand against the tough competition. The future is truly yours to seize with this Python for Data Science & Machine Learning: Zero to Hero. Enrol today and complete the course to achieve a certificate that can change your career forever.
After studying the course, an MCQ exam or assignment will test your skills and knowledge. You have to get a score of 60% to pass the test and get your certificate.
Upon successfully completing the final assessment, you’ll unlock a CPD-accredited Certificate of Achievement—a valuable credential that demonstrates your commitment to professional development. The PDF Certificate is priced at £5.99 and will be emailed to you immediately. Also, A printed Hard copy Certificate can be purchased for £12.99 and will be sent to your address by post.
This Python for Data Science & Machine Learning: Zero to Hero is suitable for anyone aspiring to start a career in relevant field; even if you are new to this and have no prior knowledge, this course is going to be very easy for you to understand.
On the other hand, if you are already working in this sector, this course will be a great source of knowledge for you to improve your existing skills and take them to the next level.
This course has been developed with maximum flexibility and accessibility, making it ideal for people who don’t have the time to devote to traditional education.
You don’t need any educational qualifications or experience to enrol in the Python for Data Science & Machine Learning: Zero to Hero course.
Do note: You must be at least 16 years old to enrol.
Any internet-connected device, such as a computer, tablet, or smartphone, can access this online course.
The certification and skills you get from this Python for Data Science & Machine Learning: Zero to Hero Course can help you advance your career and gain expertise in several fields, allowing you to apply for high-paying jobs in related sectors.
1. You need to find the right course on our IOMH website at first. You can search for any course or find the course from the Courses section of our website.
2. Click on Take This Course button, and you will be directed to the Cart page.
3. You can update the course quantity and also remove any unwanted items in the CART and after that click on the Checkout option and enter your billing details.
4. Once the payment is made, you will receive an email with the login credentials, and you can start learning after logging into the portal.
After purchasing the course, you should receive an email with the login credentials within 24 hours. Please check your spam or junk folder if you didn’t receive it in your inbox. You can access your courses by logging into your account. If you still need any assistance, please get in touch with our Customer Support team by providing the details of your purchase.
You should receive your Digital Certificate within 24 hours after placing the order, and it will take 3-9 days to deliver the hard copies to your address if you are in the UK.
For International Delivery, it will take 20-25 days.
If you require any assistance, get in touch with our dedicated Customer Support team, and your queries/issues will be dealt with accordingly.
You can make the payment using PayPal or you can Bank Transfer the amount.
For Bank transfer you will require an invoice from us and you need to contact our Customer Support team and provide details of your purchase to get the invoice.
After that, you will receive an email with the invoice and bank details and you can make the payment accordingly.
We are an online course provider, and learners from anywhere in the world can enrol on our courses using an internet-connected device.
To resolve this issue, please log out of your account and then log back in.
| Introduction | |||
| Introduction to Python | 00:01:00 | ||
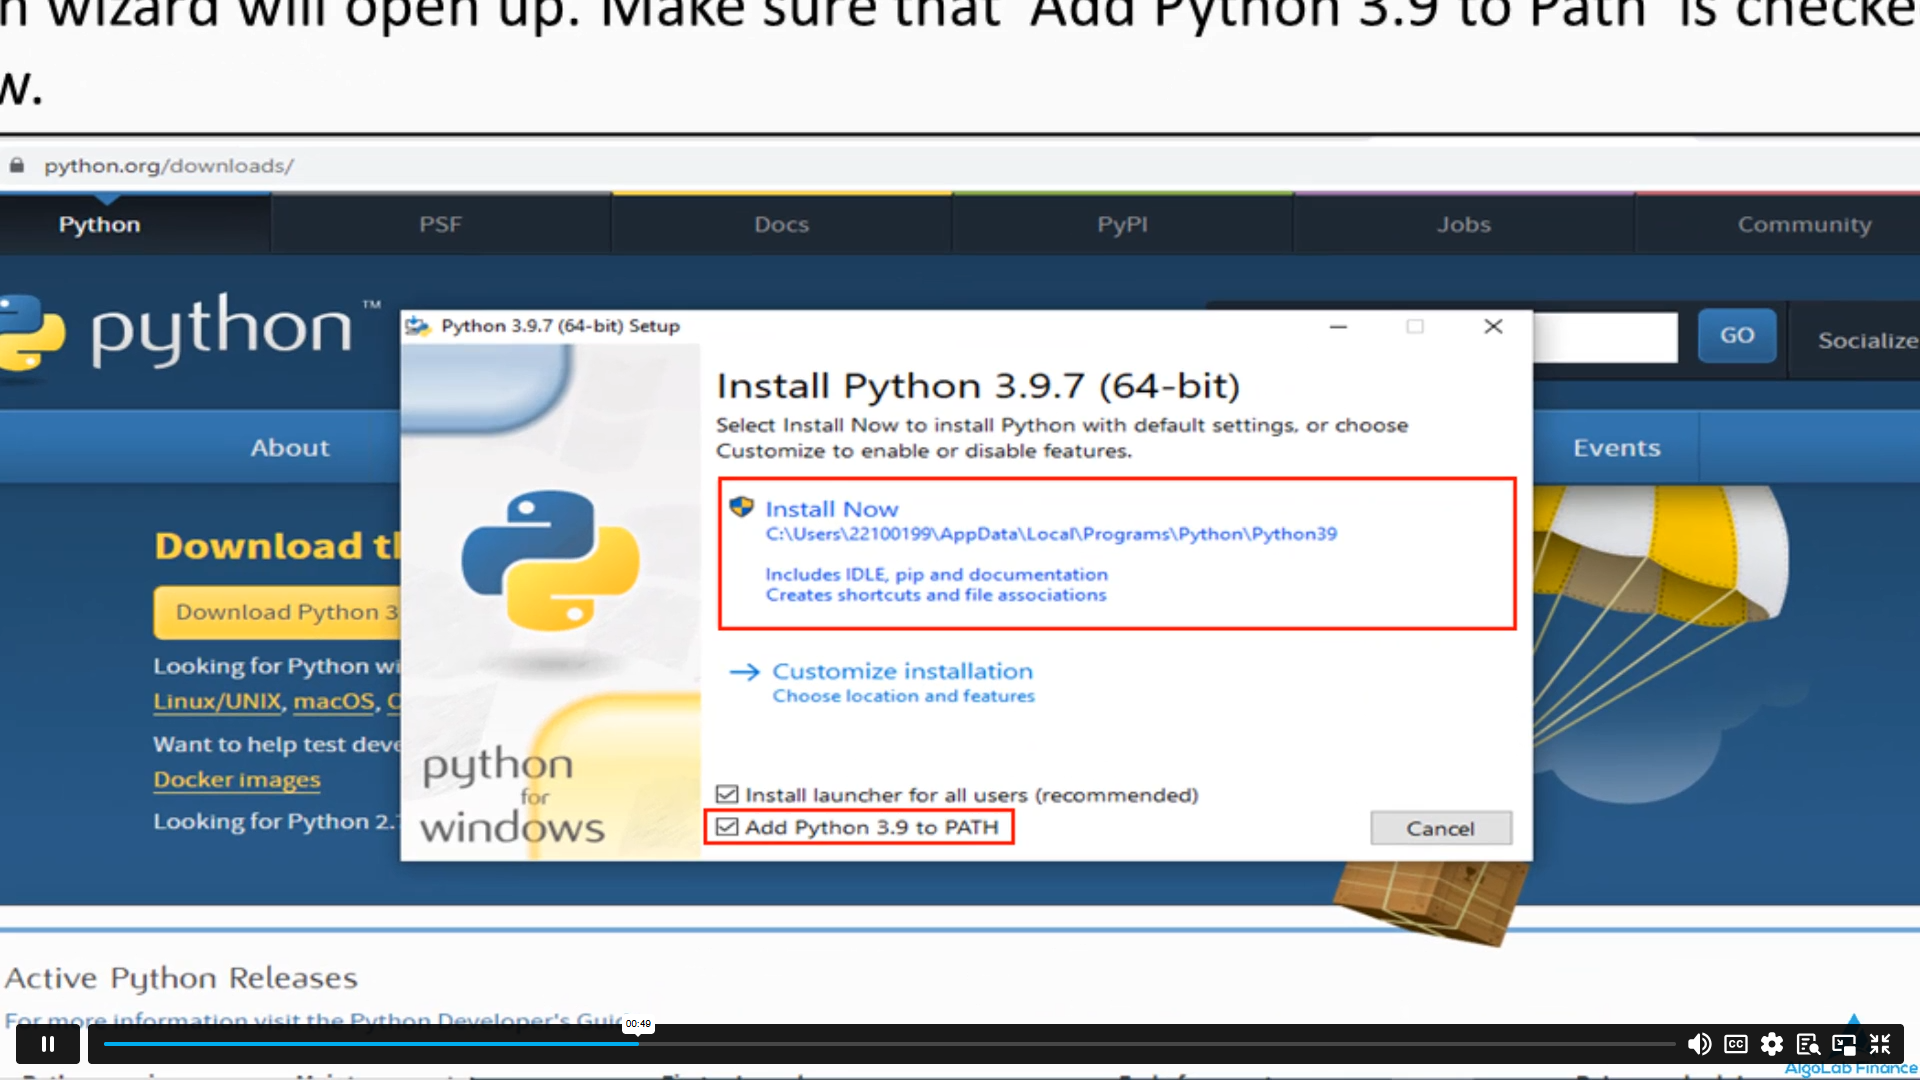
| Setting Up Python | 00:02:00 | ||
| What is Jupyter? | 00:01:00 | ||
| Anaconda Installation Windows Mac and Ubuntu | 00:04:00 | ||
| How to implement Python in Jupyter | 00:01:00 | ||
| Managing Directories in Jupyter Notebook | 00:03:00 | ||
| Input & Output | 00:02:00 | ||
| Working with different datatypes | 00:01:00 | ||
| Variables | 00:02:00 | ||
| Arithmetic Operators | 00:02:00 | ||
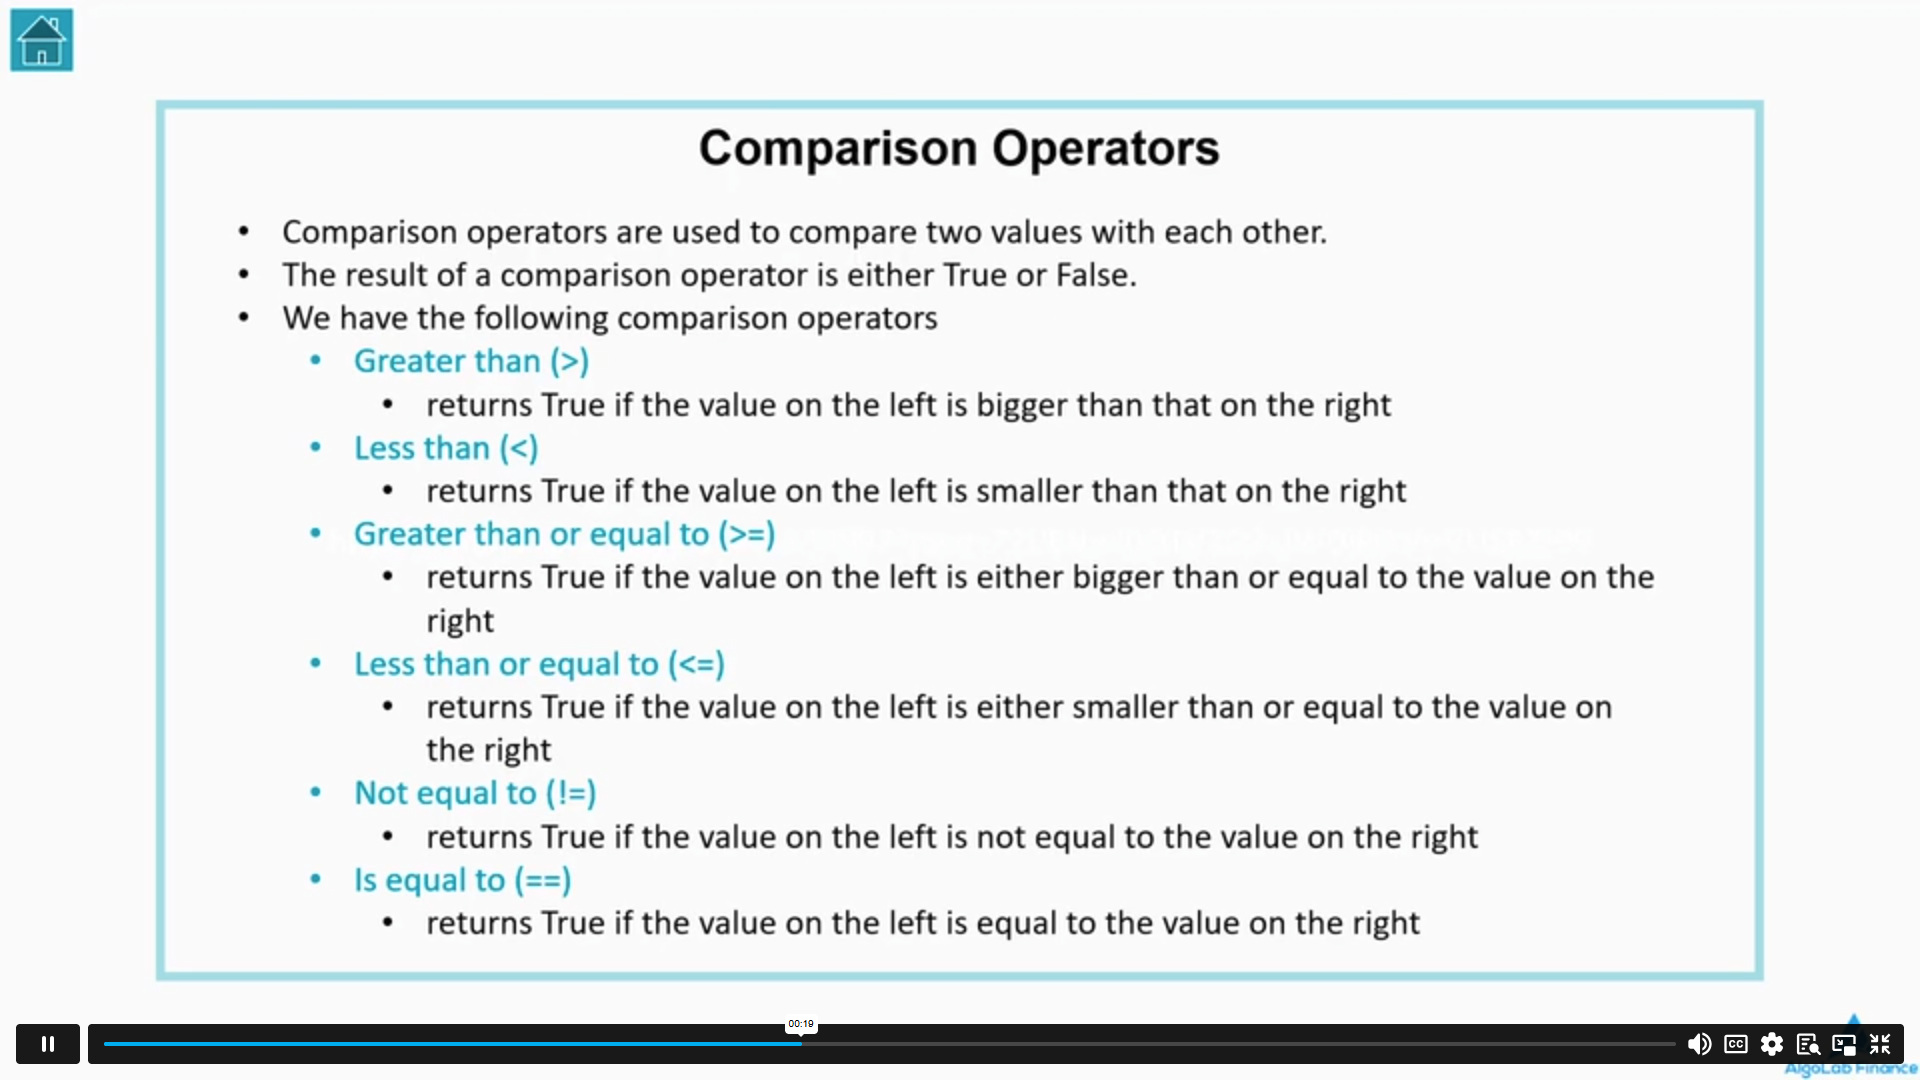
| Comparison Operators | 00:01:00 | ||
| Logical Operators | 00:04:00 | ||
| Conditional statements | 00:02:00 | ||
| Loops | 00:04:00 | ||
| Sequences Part 1: Lists | 00:03:00 | ||
| Sequences Part 2: Dictionaries | 00:03:00 | ||
| Sequences Part 3: Tuples | 00:01:00 | ||
| Functions Part 1: Built-in Functions | 00:01:00 | ||
| Functions Part 2: User-defined Functions | 00:03:00 | ||
| Course Materials | 00:00:00 | ||
| The Must-Have Python Data Science Libraries | |||
| Installing Libraries | 00:01:00 | ||
| Importing Libraries | 00:01:00 | ||
| Pandas Library for Data Science | 00:01:00 | ||
| NumPy Library for Data Science | 00:01:00 | ||
| Pandas vs NumPy | 00:03:00 | ||
| Matplotlib Library for Data Science | 00:01:00 | ||
| Seaborn Library for Data Science | 00:01:00 | ||
| NumPy Mastery: Everything you need to know about NumPy | |||
| Introduction to NumPy arrays | 00:01:00 | ||
| Creating NumPy arrays | 00:06:00 | ||
| Indexing NumPy arrays | 00:06:00 | ||
| Array shape | 00:01:00 | ||
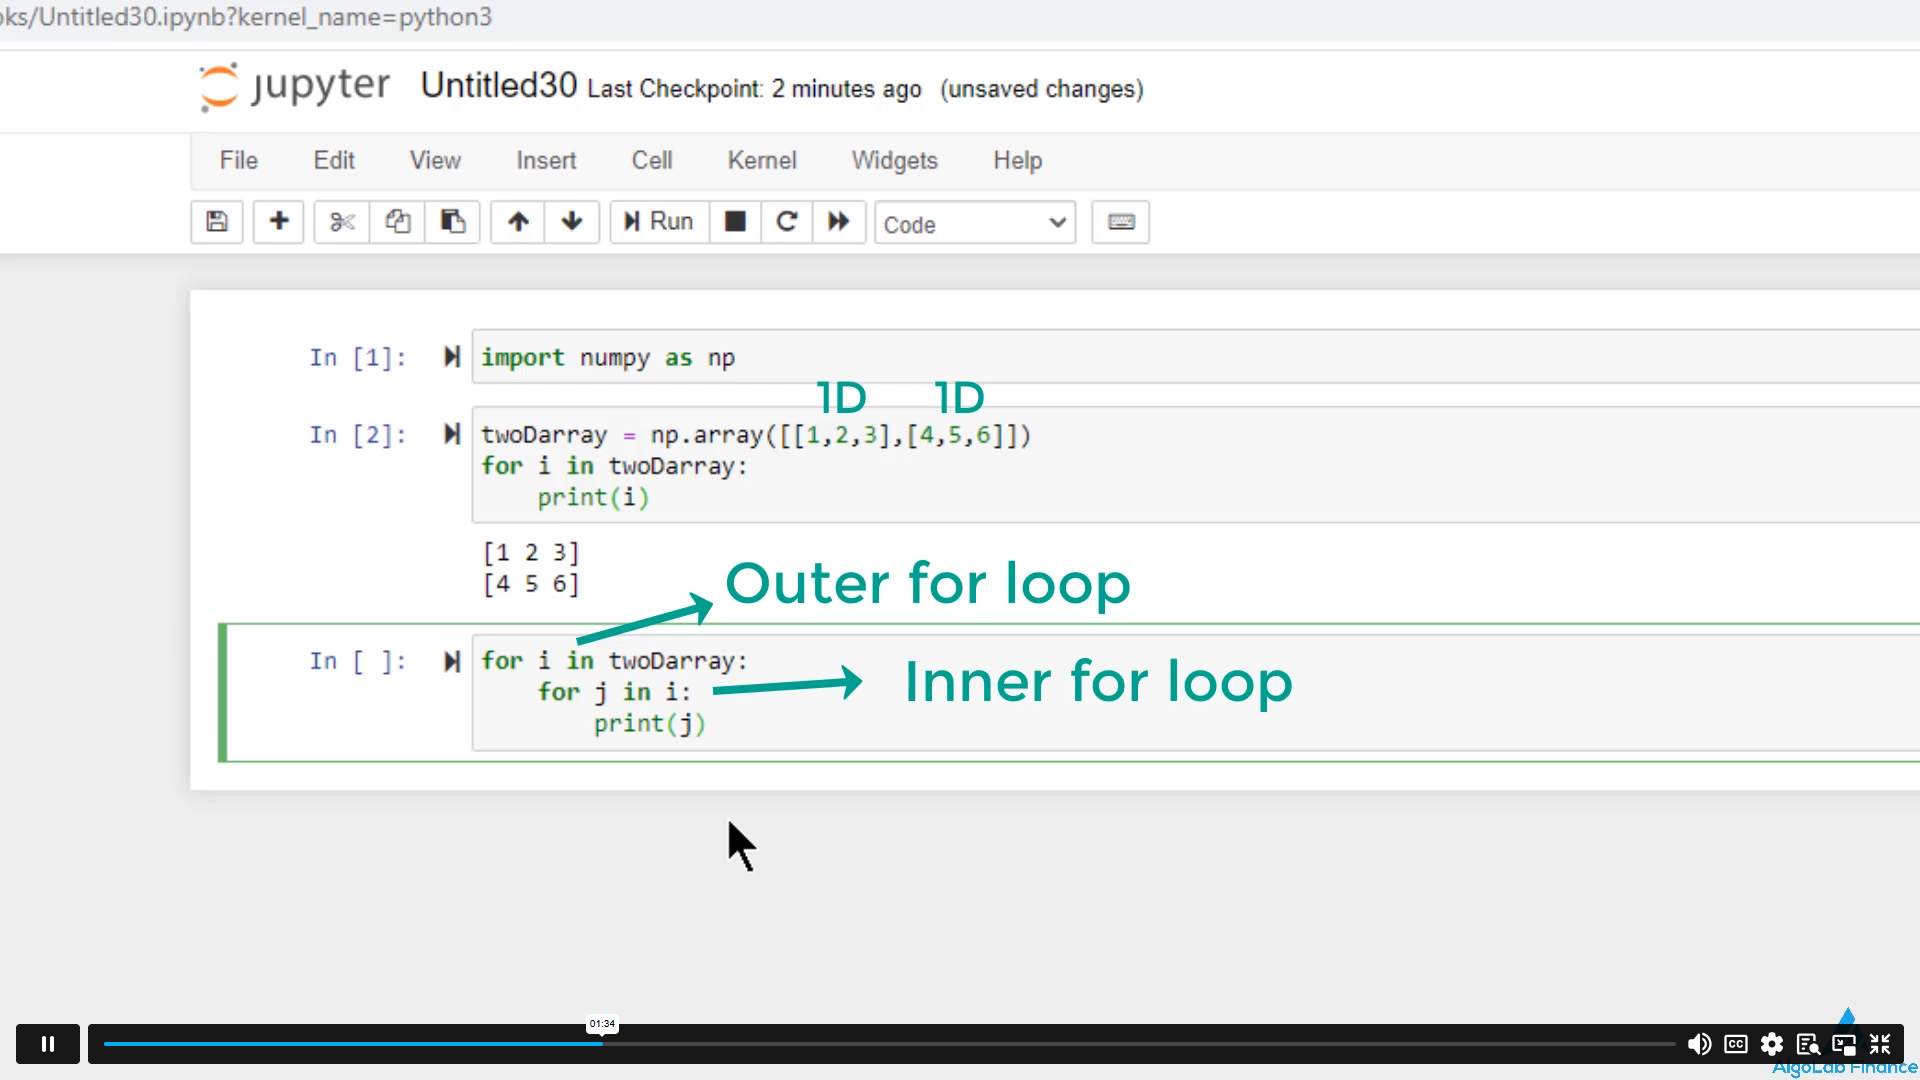
| Iterating Over NumPy Arrays | 00:05:00 | ||
| Basic NumPy arrays: zeros() | 00:02:00 | ||
| Basic NumPy arrays: full() | 00:01:00 | ||
| Basic NumPy arrays: ones() | 00:01:00 | ||
| Adding a scalar | 00:02:00 | ||
| Subtracting a scalar | 00:02:00 | ||
| Multiplying by a scalar | 00:01:00 | ||
| Dividing by a scalar | 00:01:00 | ||
| Raise to a power | 00:01:00 | ||
| Transpose | 00:01:00 | ||
| Element-wise division | 00:01:00 | ||
| Element-wise subtraction | 00:03:00 | ||
| Element-wise multiplication | 00:01:00 | ||
| Element-wise addition | 00:02:00 | ||
| Matrix multiplication | 00:02:00 | ||
| Statistics | 00:03:00 | ||
| DataFrames and Series in Python's Pandas | |||
| What is a Python Pandas DataFrame? | 00:01:00 | ||
| What is a Python Pandas Series? | 00:01:00 | ||
| DataFrame vs Series | 00:01:00 | ||
| Creating a DataFrame using lists | 00:03:00 | ||
| Creating a DataFrame using a dictionary | 00:01:00 | ||
| Loading CSV data into python | 00:05:00 | ||
| Changing the Index Column | 00:01:00 | ||
| Inplace | 00:01:00 | ||
| Examining the DataFrame: Head & Tail | 00:01:00 | ||
| Statistical summary of the DataFrame | 00:01:00 | ||
| Slicing rows using bracket operators | 00:01:00 | ||
| Indexing columns using bracket operators | 00:01:00 | ||
| Boolean list | 00:01:00 | ||
| Filtering Rows | 00:01:00 | ||
| Filtering rows using AND OR operators | 00:02:00 | ||
| Filtering data using iloc() | 00:02:00 | ||
| Filtering data using loc() | 00:04:00 | ||
| Adding and deleting rows and columns | 00:03:00 | ||
| Sorting values | 00:01:00 | ||
| Exporting and saving pandas DataFrames | 00:01:00 | ||
| Concatenating DataFrames | 00:01:00 | ||
| groupby() | 00:03:00 | ||
| Data Cleaning Techniques for Better Data | |||
| Introduction to Data Cleaning | 00:01:00 | ||
| Quality of Data | 00:02:00 | ||
| Examples of Anomalies | 00:01:00 | ||
| Median-based Anomaly Detection | 00:03:00 | ||
| Z-score-based Anomaly Detection | 00:03:00 | ||
| Interquartile Range for Anomaly Detection | 00:05:00 | ||
| Dealing with missing values | 00:06:00 | ||
| Regular Expressions | 00:07:00 | ||
| Feature Scaling | 00:03:00 | ||
| Exploratory Data Analysis in Python | |||
| What is Exploratory Data Analysis? | 00:01:00 | ||
| Univariate Analysis | 00:02:00 | ||
| Univariate Analysis: Continuous Data | 00:06:00 | ||
| Univariate Analysis: Categorical Data | 00:02:00 | ||
| Bivariate analysis: Continuous & Categorical | 00:02:00 | ||
| Bivariate analysis: Continuous & Categorical | 00:02:00 | ||
| Bivariate analysis: Continuous & Continuous | 00:05:00 | ||
| Detecting Outliers | 00:06:00 | ||
| Categorical Variable Transformation | 00:04:00 | ||
| Python for Time-Series Analysis: A Primer | |||
| Getting stock data using yfinance | 00:03:00 | ||
| Converting a Dataset into Time Series | 00:04:00 | ||
| Working with Time Series | 00:04:00 | ||
| Visualising a Time Series | 00:03:00 | ||
| Python for Data Visualisation: Library Resources, and Sample Graphs | |||
| Data Visualisation using python | 00:01:00 | ||
| Setting Up Matplotlib | 00:01:00 | ||
| Plotting Line Plots using Matplotlib | 00:02:00 | ||
| Title, Labels & Legend | 00:07:00 | ||
| Plotting Histograms | 00:01:00 | ||
| Plotting Bar Charts | 00:03:00 | ||
| Plotting Pie Charts | 00:03:00 | ||
| Plotting Scatter Plots | 00:06:00 | ||
| Plotting Log Plots | 00:02:00 | ||
| Plotting Polar Plots | 00:02:00 | ||
| Handling Dates | 00:01:00 | ||
| Creating multiple subplots in one figure | 00:03:00 | ||
| The Basics of Machine Learning | |||
| What is Machine Learning? | 00:02:00 | ||
| Applications of machine learning | 00:02:00 | ||
| Machine Learning Methods | 00:01:00 | ||
| What is Supervised learning? | 00:01:00 | ||
| What is Unsupervised learning? | 00:01:00 | ||
| Supervised learning vs Unsupervised learning | 00:04:00 | ||
| Simple Linear Regression with Python | |||
| Introduction to regression | 00:02:00 | ||
| How Does Linear Regression Work? | 00:02:00 | ||
| Line representation | 00:01:00 | ||
| Implementation in python: Importing libraries & datasets | 00:02:00 | ||
| Implementation in python: Distribution of the data | 00:02:00 | ||
| Implementation in python: Creating a linear regression object | 00:00:00 | ||
| Multiple Linear Regression with Python | |||
| Understanding Multiple linear regression | 00:02:00 | ||
| Exploring the dataset | 00:01:00 | ||
| Encoding Categorical Data | 00:03:00 | ||
| Splitting data into Train and Test Sets | 00:01:00 | ||
| Training the model on the Training set | 00:01:00 | ||
| Predicting the Test Set results | 00:03:00 | ||
| Evaluating the performance of the regression model | 00:01:00 | ||
| Root Mean Squared Error in Python | 00:02:00 | ||
| Classification Algorithms: K-Nearest Neighbors | |||
| Introduction to classification | 00:01:00 | ||
| K-Nearest Neighbours algorithm | 00:01:00 | ||
| Example of KNN | 00:01:00 | ||
| K-Nearest Neighbours (KNN) using python | 00:01:00 | ||
| Importing required libraries | 00:01:00 | ||
| Importing the dataset | 00:04:00 | ||
| Splitting data into Train and Test Sets | 00:01:00 | ||
| Feature Scaling | 00:01:00 | ||
| Importing the KNN classifier | 00:02:00 | ||
| Results prediction & Confusion matrix | 00:02:00 | ||
| Classification Algorithms: Decision Tree | |||
| Introduction to decision trees | 00:01:00 | ||
| What is Entropy? | 00:01:00 | ||
| Decision tree structure | 00:01:00 | ||
| Importing libraries & datasets | 00:01:00 | ||
| Encoding Categorical Data | 00:05:00 | ||
| Splitting data into Train and Test Sets | 00:02:00 | ||
| Results Prediction & Accuracy | 00:03:00 | ||
| Classification Algorithms: Logistic regression | |||
| Implementation steps | 00:01:00 | ||
| Importing libraries & datasets | 00:02:00 | ||
| Splitting data into Train and Test Sets | 00:03:00 | ||
| Pre-processing | 00:02:00 | ||
| Training the model | 00:01:00 | ||
| Results prediction & Confusion matrix | 00:02:00 | ||
| Logistic Regression vs Linear Regression | 00:02:00 | ||
| Clustering | |||
| Introduction to clustering | 00:01:00 | ||
| Use cases | 00:01:00 | ||
| K-Means Clustering Algorithm | 00:01:00 | ||
| Elbow method | 00:02:00 | ||
| Steps of the Elbow method | 00:01:00 | ||
| Implementation in python | 00:04:00 | ||
| Hierarchical clustering | 00:01:00 | ||
| Density-based clustering | 00:02:00 | ||
| Implementation of k-means clustering in python | 00:01:00 | ||
| Visualising the dataset | 00:02:00 | ||
| Defining the classifier | 00:02:00 | ||
| 3D Visualisation of the clusters | 00:03:00 | ||
| 3D Visualisation of the predicted values | 00:03:00 | ||
| Number of predicted clusters | 00:02:00 | ||
| Recommender System | |||
| Introduction (Recommender System) | 00:01:00 | ||
| Collaborative Filtering in Recommender Systems | 00:01:00 | ||
| Content-based Recommender System | 00:01:00 | ||
| Importing libraries & datasets | 00:05:00 | ||
| Merging datasets into one dataframe | 00:01:00 | ||
| Sorting by title and rating | 00:04:00 | ||
| Histogram showing number of ratings | 00:01:00 | ||
| Frequency distribution | 00:01:00 | ||
| Jointplot of the ratings and number of ratings | 00:01:00 | ||
| Data pre-processing | 00:02:00 | ||
| Sorting the most-rated movies | 00:01:00 | ||
| Grabbing the ratings for two movies | 00:01:00 | ||
| Correlation between the most-rated movies | 00:02:00 | ||
| Sorting the data by correlation | 00:01:00 | ||
| Filtering out movies | 00:01:00 | ||
| Sorting Values | 00:02:00 | ||
| Repeating the process for another movie | 00:02:00 | ||
| Conclusion | |||
| Conclusion | 00:01:00 | ||
Save Up To 95% -
This course includes:
4.7 (8 reviews)
365 days
25 Students

4.7 (8 reviews)
365 days
27 Students

COPYRIGHT © 2021 Institute of Mental Health